The Beginner's Guide to Resource Utilization
One of the main KPIs to track in a services / project-oriented business is resource utilization. Through resource utilization in project management, agencies and consulting businesses (or any professional services companies for that matter) are able to monitor productivity and identify bottlenecks as they happen.
However, many companies underestimate the importance of having a resource utilization plan and tracking the actuals. In fact, HubSpot's 2018 Marketing Agency Growth Report discovered that only 58% of agencies are tracking their team's utilization rates! On the other side, some take it too seriously treating employees as if they were machines and slowly taking over their lives.
So what exactly is resource utilization? What is the best level of resource utilization to target? Is the ultimate goal always 100%? Moreover, what does this mean for your business in a more practical sense? Let’s dive right into it.
- What is resource utilization?
- The optimal level resource utilization
- Resource allocation vs. resource utilization
- Why calculate resource utilization
- When resource utilization backfires
- How to measure resource utilization correctly
- Resource utilization software
What is resource utilization rate?
Resource utilization means ‘time spent working,’ and is thus a measure of time spent productively. In other words, an effective utilization of available time. There are various ways to track this time and different methods and definitions of utilized time. The resource utilization formula ultimately depends on your business and preferences. In Forecast, we distinguish two ways of measuring utilization levels
- Resource utilization
- Billable utilization
Resource utilization
Resource utilization, as the name suggests, measures the utilization of your available resources. It’s the simplest means of measuring utilization and a general business metric to keep track of the daily productivity of your employees. This method factors in your team member’s time spent on both billable and non-billable time. The formula used for calculating resource utilization is:
(Total Registered Hours / Total Hours Available)* 100.
Billable utilization
In turn, billable utilization measures the total billable hours spent on a client project or task. This method excludes any internal projects or business development, which might be a part of the schedule as well. Billable utilization rate is a percentage scale from 0 – 100%, calculated using the following formula:
(Total Registered Billable Hours / Total Hours Available)* 100.
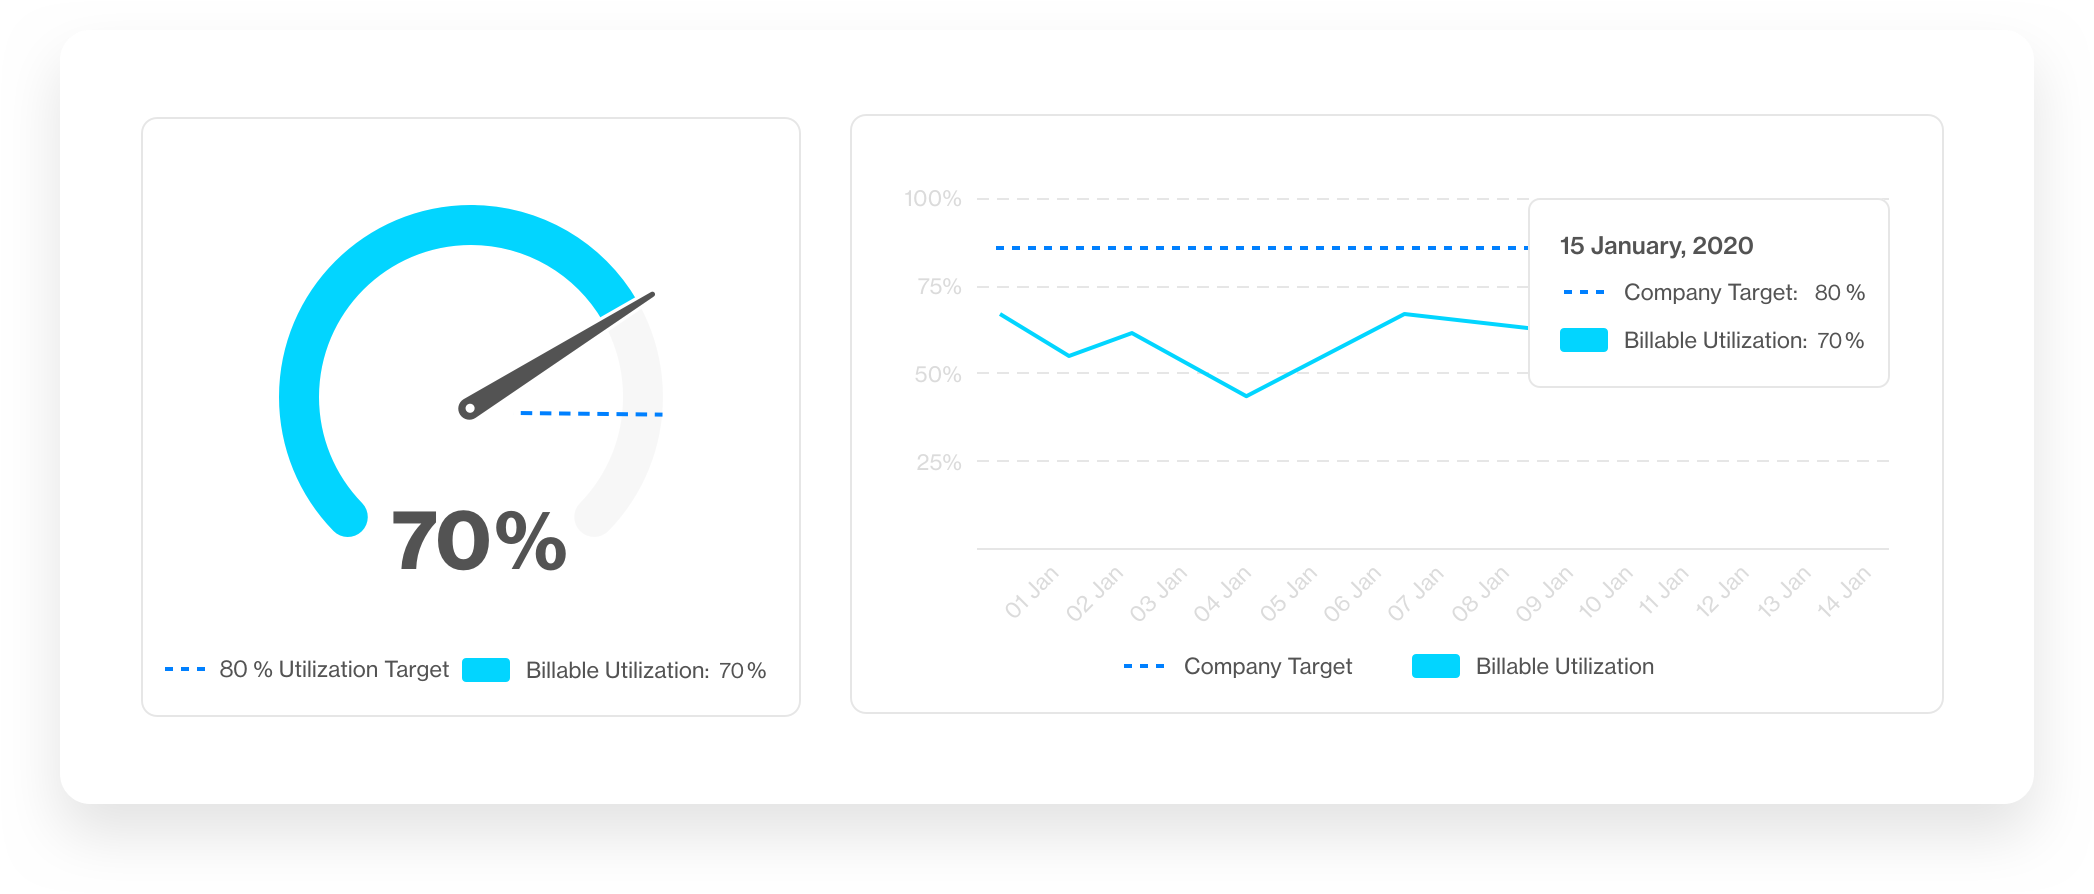
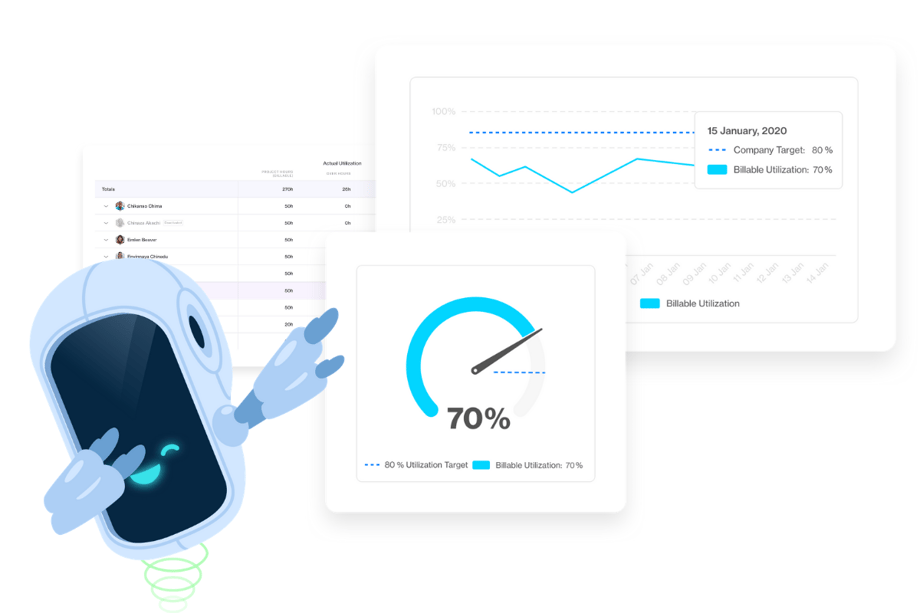
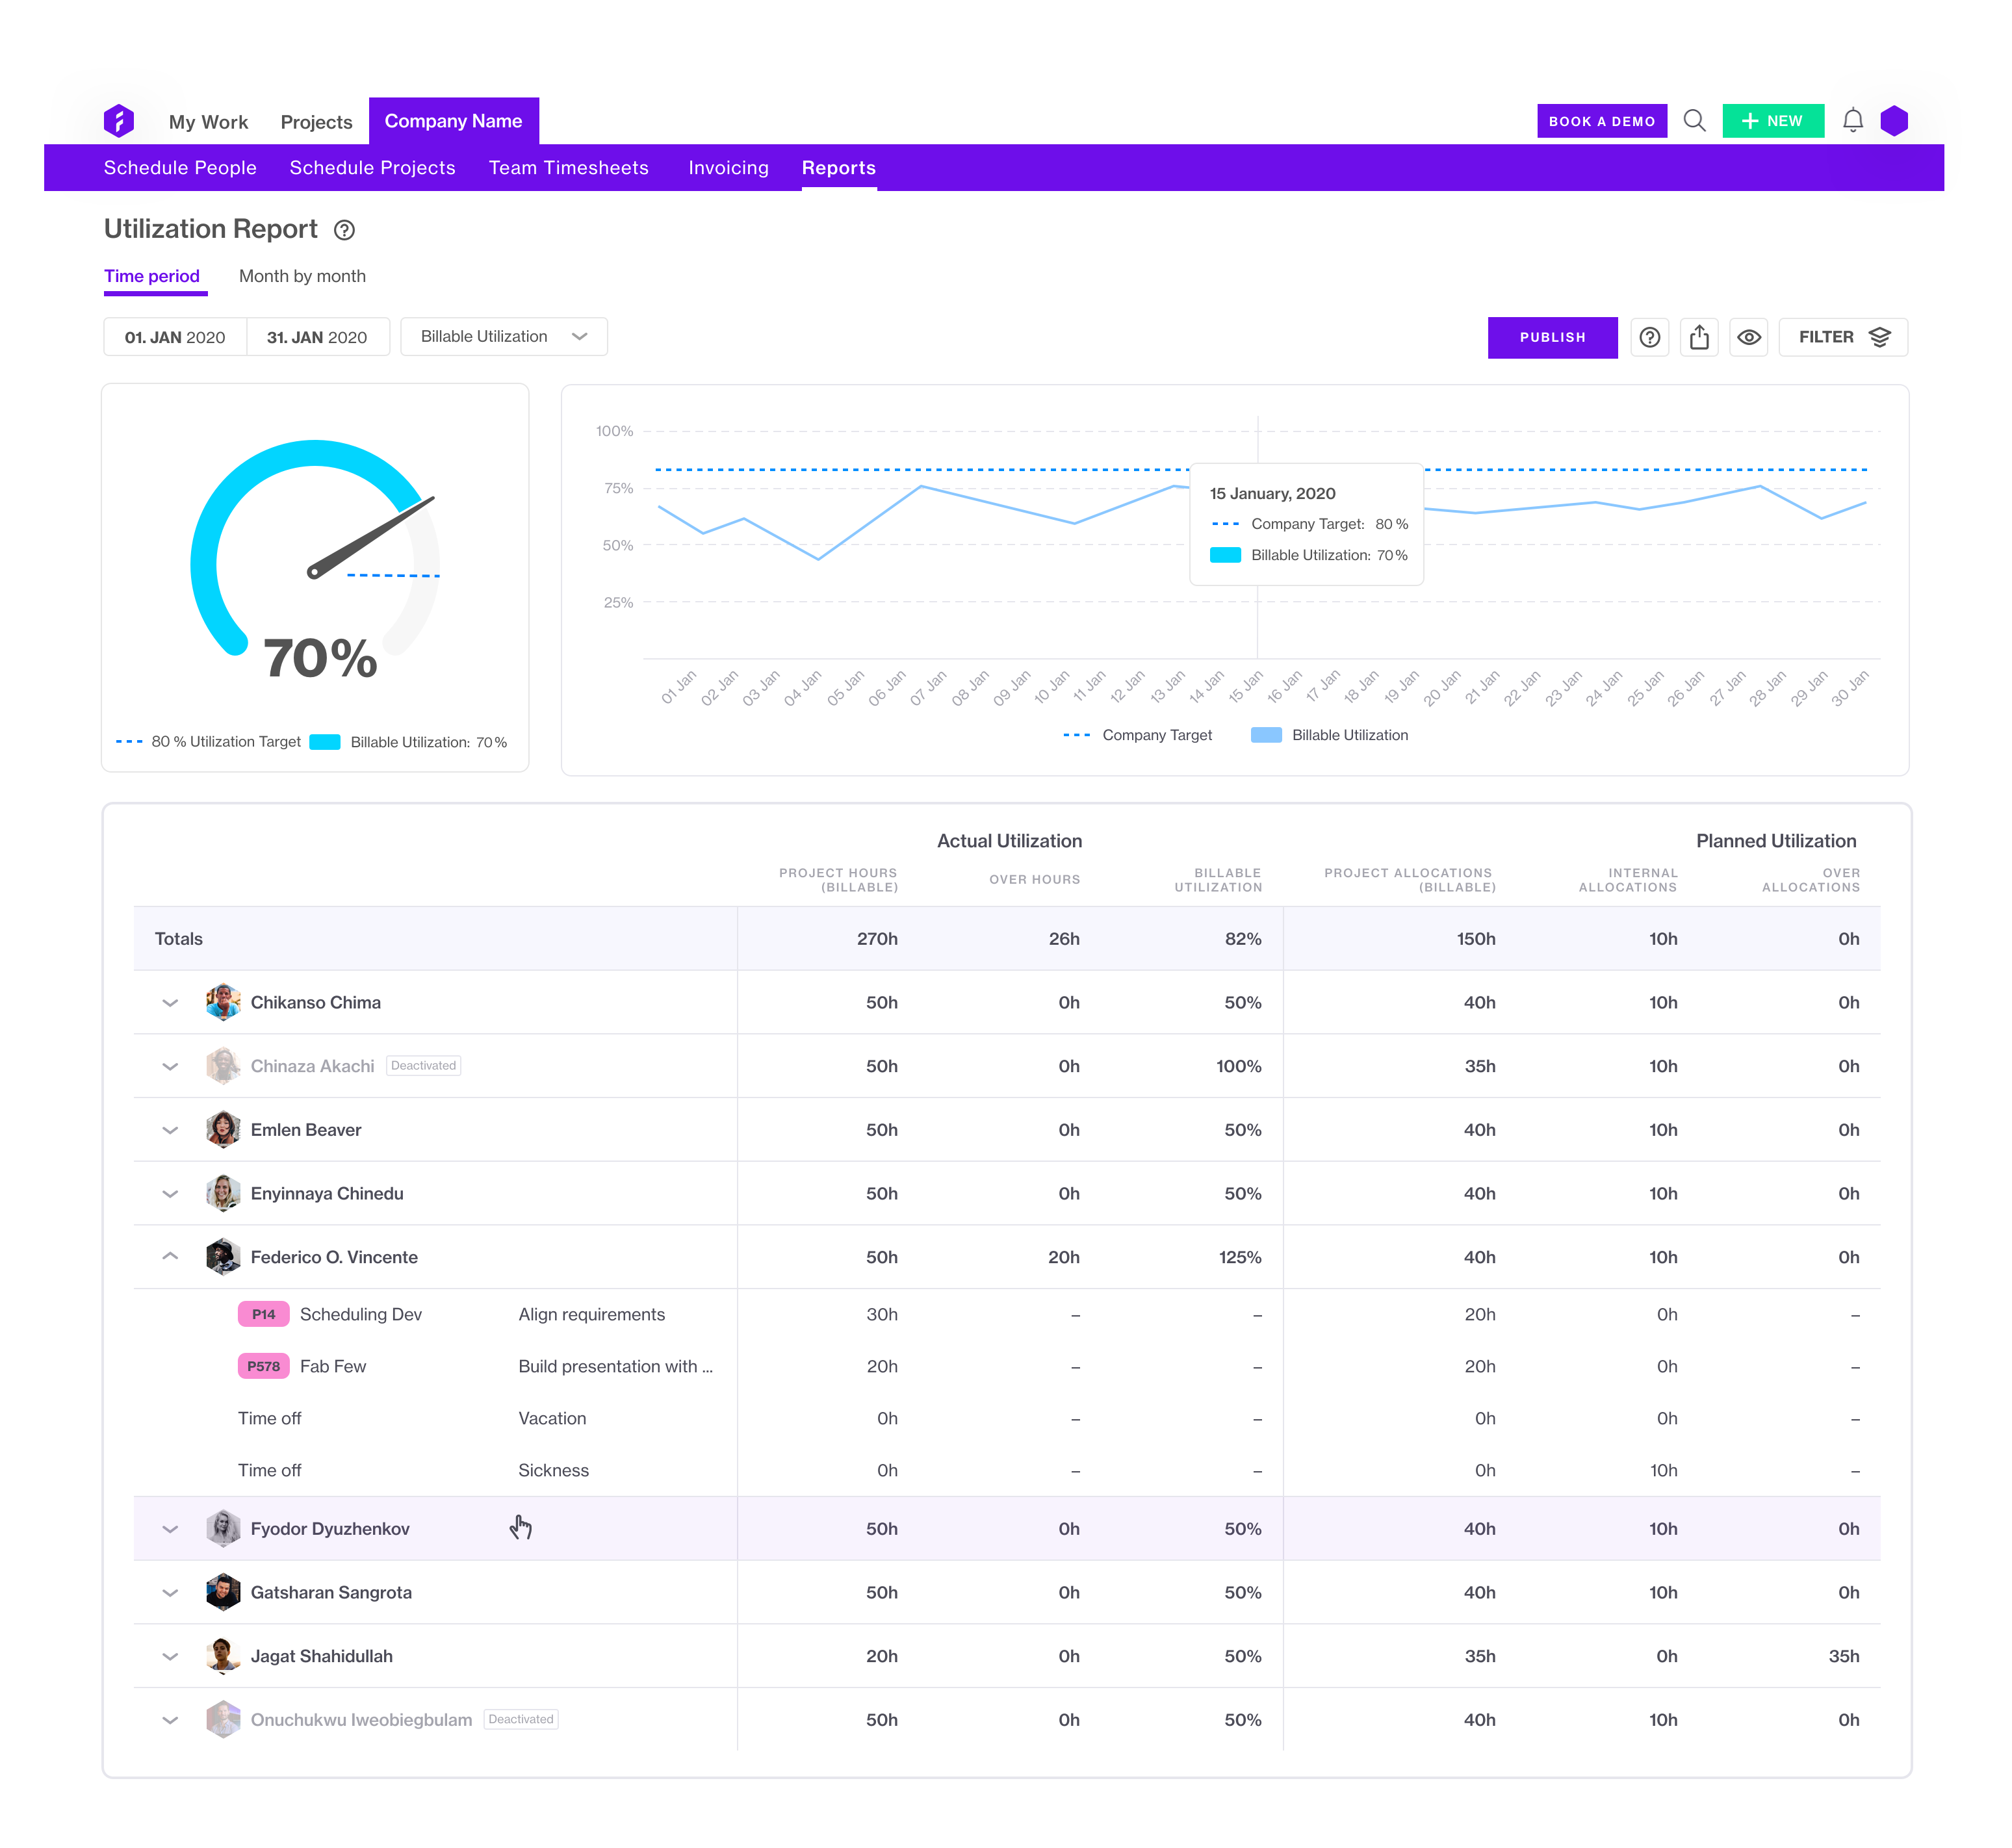
The barometer on Forecast's Utilization report, tracking billable utilization against the company target.
The optimal level of resource utilization
The optimal rates will vary depending on how you calculate utilization in your company. If you count in all time spent in the business (both billable and non-billable time), an appropriate utilization level to target would most often be between 100%.
The rate calculated with the billable utilization method, however, will naturally be lower. In this case, an appropriate level to target would most probably be between 70-80%, since there will always be time spent on other important tasks that are not directly linked to a client.
Read on: Getting Started with Resource Management - A Complete Guide
Lower-than-expected resource utilization is often a wake-up call that the project has a surplus of resources and is over-staffed. Higher-than-expected resource utilization can mean that someone is overloaded with work. So whenever there are resource shortages in your company, utilization will be at its peak and vice versa. In any case, if resource utilization is not on the desired point, you might want to investigate it further and will often be surprised what caused the percentage to spike or drop down.
What is most important is that you keep a consistent process of tracking resource utilization. Define and develop the right method for you, and maintain this method consistently to ensure a proper way of comparing from phase to phase and across teams and the industry.
Resource allocation vs. resource utilization
There’s often confusion between resource allocation and resource utilization, so we’ll also explain the difference between the two. Resource allocation, by definition, is the appointment of resources to projects and tasks. In other words, your resource management plan that indicates how you’re going to utilize your resources.
Read on: 6 Resource Allocation Best Practices You Can't Afford to Ignore
While resource allocation data is taken into account when calculating your planned utilization, resource utilization is the actual real-time measurement of time spent and productivity.
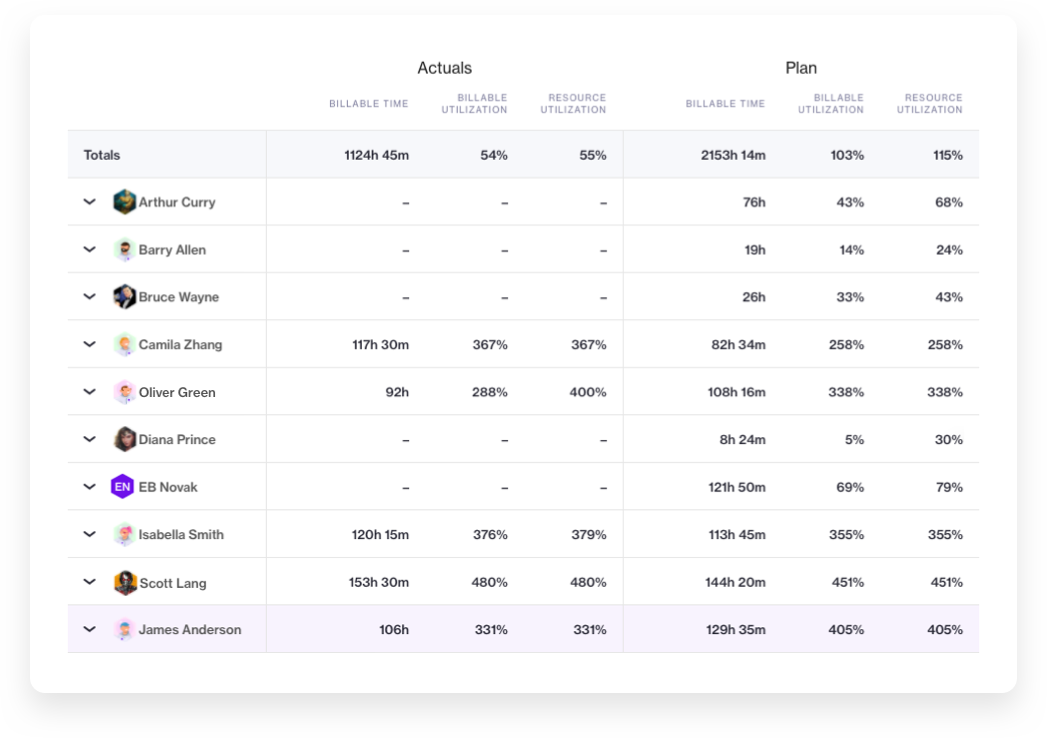
Actual vs Planned Utilization in Forecast's report
Why calculate resource utilization
The benefits of calculating resource utilization are numerous. It can become a helping hand in the decision-making process across all stages of the project and inform hiring decisions. Because it is a metric that signals whether your employees are fully booked, it helps you plan for future projects or optimize the current ones. Seeing who is over- or underutilized can also say a lot about which roles are in demand in your company and help management make sure people don’t just sit on the bench.
If used in the right way, resource utilization can mean focus for employees and profitability for your projects, especially if you’re selling time and your team’s expertise. Billable resource utilization is key to higher margins as it puts emphasis on client work. Consider reading the success story of Sagittarius, a UK agency. Since they started using Forecast and taught employees to differentiate between project and non-project work, they’ve become more efficient.
One way Sagittarius uses Forecast is to report on utilization on a weekly basis, but from time to time, their CEO is curious how the Studio’s utilization figures look like weekly, monthly, and quarterly to report to board members. Forecast’s ‘zoom-in and zoom-out’ function is a savior for project managers in the sense they don’t need to create different reports for every occasion.
When resource utilization backfires
However, there are cases when this metric is misunderstood and used poorly. A common mistake we usually see, especially with billable utilization, is that executives set targets at 100%, not factoring in admin time, meetings, training, or other internal time. As explained before, you can’t expect more than 80% utilization on billable projects unless your resources are machines.
Resource utilization, in turn, goes awry when you apply it to evaluate individual performance. Measuring resource utilization is a good way to assess overall company performance, but not so good when it comes to individual metrics. If you notice a low utilization rate, processes are to blame, not people. Remember that each function should have a specific KPI and should NOT be assessed solely based on a utilization rate.
How to measure resource utilization correctly
There’s no right or wrong way of tracking, but one thing is very crucial for keeping useful data and measurements. Consistency. Consistency is paramount to ensure a reliable comparable data set from period to period.
Secondly, it’s important to categorize types of tasks into billable and non-billable time. What is billable time in your organization? It is highly recommended that project managers go together and define these categories. Thus, you’ll make sure that each team member doesn’t have to think about where to put each task themselves. This will definitely increase the quality of your data, and make you able to compare different teams.
Thirdly, utilization reporting is impossible without introducing timesheets. Because in both utilization formulas we rely on registered hours, time registrations should become part of the daily routine in your organization.
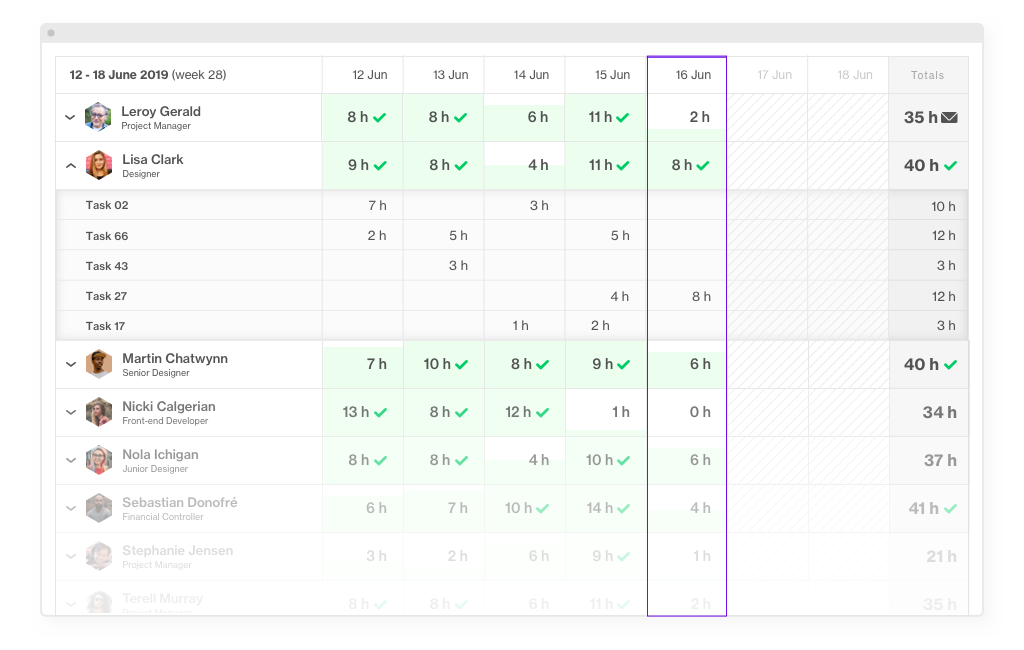
Team Timesheet in Forecast
What also matters a lot in measuring resource utilization is the full picture of the available hours for each team member. This value can be both with or without company holidays, personal vacations, sick days, etc., but again the key is consistency throughout the organization. Moreover, global companies have to be very aware about differences from country to country; as these standards of measurements may differ, and the same with the amount of holidays, etc.
A great basic number of available hours per year to start with is 2,080 hours (40 hours per week * 52 weeks). Then from this you subtract holidays and other points. Remember that if you use the baseline, 2,080 hours, in your calculation of utilization - the utilization level will decrease from the beginning, and naturally never reach a level of 100%. Here again, as in the case of the billable utilization method, an appropriate target of utilization would often be between 70-80%. On the contrary, if the baseline excludes holidays, vacation, sick days, etc., then an appropriate level of utilization would often be between 80-100%.
Before deciding on a method for your business, it’s often a good idea to get inspiration from peers, competitors, and the standards of your industry. This way it’s easier to compare your data. Moreover, knowing your absolute minimum utilization per resource and bill rate to reach your revenue and margin targets is a great start to compare your data with. Everything above this level will obviously be profitable. This can be a quite complex calculation or a rather simple one depending on your circumstances.
Resource utilization software
In measuring and improving resource utilization, a full-suite project and resource management software is key. With Forecast’s new Utilization report, you’ll get a configurable resource utilization chart with a list of people utilization data for the entire account, connected to your project and resource schedule.
Schedule is the place to plan out, and allocate your people to projects. We've had two main focus points in mind regarding the User Interface (UI) of the Schedule view. Our goal is to give you a visually scalable overview of your schedule.
The two main views in scheduling are People & Projects, from where you can manage your entire portfolio of projects and where you can view your teams and their tasks. This makes it possible for you to adjust the schedule per your business needs, allocating people to projects, or allocating projects to people.
From the People View, you'll see the Heat Map, where you can easily understand the utilization of your team members - whether they are over, under, or perfectly allocated. Alternatively, from the Projects view, see the progress of your tasks/projects. From both places, you can create things like; tasks, milestones, or allocations.
Achieving a higher utilization rate requires excellent scheduling skills, and generally a good management process. Wouldn’t it be great with a system that could assist your assumptions and help in the process?
Utilizing your resources is paramount to running a stable and profitable business. Having everything linked in one single software will give you a one-truth hub for the information you need to take action on. Forecast intelligently connects your time, budget, and scheduling to provide you with a broader perspective. Allocating and assigning your team members is easier when you know what is going on, what's coming up, and whether your projects are over- or under-allocated. You can easier take action if a project might suddenly be heading towards a cliff.